
Truth Bomb About "Time In" the Market
"Time in the market" is just a long-dated form of "timing" the market.

TL;DR
You’ve probably heard advice saying investing is "not about timing the market, it's about time in the market." This advice is misguided, and I’m going to tell you why.
I’m challenging the notion that long-term investing magically eliminates risk. The truth is that "time in the market" is essentially just another timing strategy with its own vulnerabilities. Average returns mask real-world volatility, sequence of returns can devastate retirement plans, and financial planning often relies on statistical methods that ignore correlation and sample independence, using mostly the same data in each sample.
Rather than following this oversimplified mantra, discover a more balanced approach that incorporates certainty alongside growth potential. Because you only get one shot at this, and your financial future deserves more than a catchy phrase based on limited historical data.
If you've spent any time around financial advisors or browsed investment forums, you've undoubtedly heard the popular mantra: "It's not about timing the market, it's about time in the market." This phrase has become something of a sacred cow in financial circles - repeated so often that few stop to question its fundamental logic.
And the logic I want to demonstrate is that “time in” the market turns out to be just another form of market “timing,” only stretched over a more extended time period.
The industry’s selective statistics
When financial advisors show you those beautiful upward-trending graphs of market performance, they're often presenting average returns that mask a more complex reality. These averages smooth out the dramatic ups and downs, creating an illusion of steady growth that rarely materializes in real portfolios.
The industry loves to showcase how a hypothetical investment would have grown over the past few decades. But these presentations conveniently gloss over a crucial fact: money doesn't grow based on averages. Real investment journeys are filled with peaks and valleys that these smoothed-out representations fail to capture.
You've probably noticed this disconnect between the perfect charts and your actual investment experience. That nagging feeling that something doesn't quite add up? It's not your imagination - it's mathematical reality.
We don’t get average returns. We get what we get.
Average returns are 100% irrelevant
The industry's approach to averages is statistically questionable. But even without the incorrect statistical assumptions, let’s look at average returns on their face, as we are told how they work.
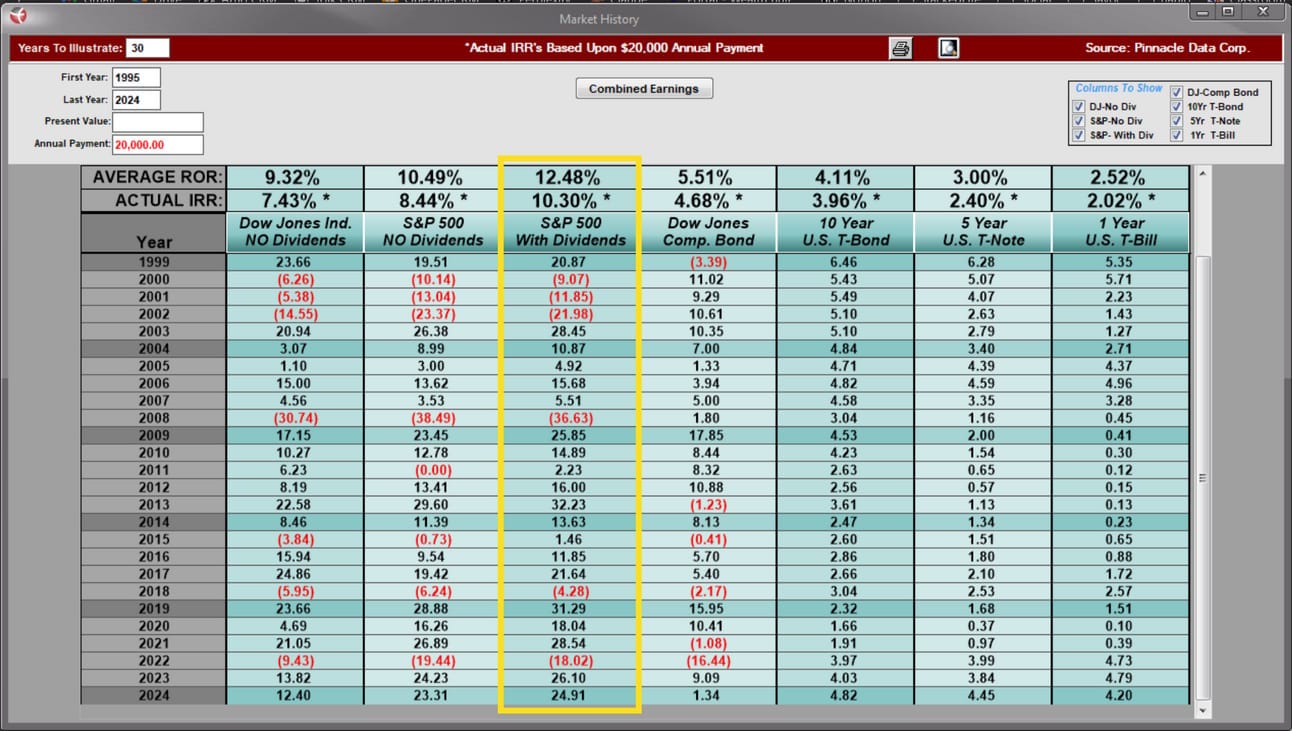
If we look at the last 30 years' average return of the S&P 500 with dividends reinvested, the “gold standard” average return vehicle, we see the average return was 12%. We need to understand that this 12% is just the mathematical sum of the returns divided by 30. It doesn’t have anything to do with what happened to our money.
Applying annual investments of $20,000/yr to this same vehicle, we see that the real rate of return was 10%.
I know that 2 percentage points doesn’t seem like the end of the world. After all, most people would consider 10% a “good” return according to the conventional index investing approach.
…until you see what it does to how much money you end up with:
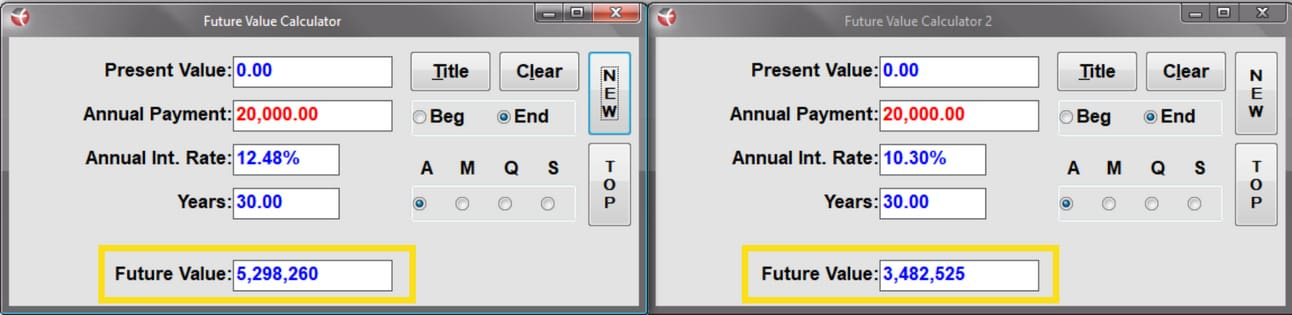
A 2 percentage point drop in our rate of return caused us to have a 34% drop in our money!
Would it be a problem if you planned on having $5M in retirement but only ended up with $3M?
By the way, according to Fed data, 90% of retirees in 2023 had less than $1M and had similar historical returns. The real world shows us that something very different than getting average returns is happening. Check out last week’s issue for more on this.
Big statistical flaw: not nearly enough data
Most concerning of all is that we have nowhere near enough data to calculate these historical averages.
It’s common to use 30-year rolling averages of market history to try to predict the future. E.g., 1990 - 2019, 1991 - 2020, 1992 - 2021, and so forth. They’ll take each 30-period and then average those returns. You can get about seventy 30-year periods from ~100 years or market history.
This creates the illusion of having 70 data points—more data points than truly exist.
Using rolling 30-year averages is like calculating the average weight in a room of 30 people by replacing just one person at a time instead of getting a fresh sample of 30 new people. Replacing one person doesn’t significantly affect the average.
Coincidentally, a “financial life” is about 70 years long (40 years working, 30 years in retirement), which again is about the number of (fake) “data points” we get from a rolling 30-year average of the 95 years of S&P 500 history. Here is what is missing:
70 years = 1 financial life span. So from the perspective of gathering statistical data about what can happen during someone’s life, the last 70 years are ONE data point!
This is a problem with data sample independence where each new 30-year average shares 29 years with the previous average.
To get what we really want when using 30-year rolling averages of market history, we’d need thirty independent 70-year periods (that’s 2,100 years) of market history to have a valid set of 30 data points for a “financial life.”
Look up Dr. David Babbel (R.I.P.) to learn more about the correct statistical analysis of market history.
Understanding sequence of returns risk
The "time in the market" philosophy suggests that, given enough time, everything works out. But this overlooks a critical reality: the long term eventually becomes the short term.
The sequence of returns (mostly when you get negative returns) matters, especially as you approach and enter retirement. Most “time in the market” strategies only consider the accumulation phase of your financial life.
But guess what? You are still “in” the market during the distribution phase of retirement, and the earlier you experience negative returns, the more likely you are to run out of money in retirement.
Two investors with identical average returns can have dramatically different outcomes depending on when negative returns occur. Imagine two retirees with identical portfolios:
Janet retires in 2008 just before the financial crisis, withdrawing 4% annually
Robert retires in 2011 after the market has recovered, also withdrawing 4% annually
Even if their portfolios average the same return over a decade, Janet might have depleted her savings years earlier because she'd been forced to sell shares at depressed prices to fund her retirement. This isn't a failure of strategy on Janet's part - it's simply bad luck with timing, something the "time in the market" mantra suggests shouldn't matter.
The risk / return reality check
The financial industry has conditioned us to believe that high risk automatically leads to high returns. This oversimplification has led many investors astray.
Taking on high risk creates the potential for high returns - but also for significant losses. There's no guarantee that enduring volatility will be rewarded, especially if you need to access your money during a downturn.
Many financial advisors behave as though the favorable historical returns of the U.S. stock market are some kind of natural law, rather than what they actually are: a specific outcome from a specific time period in a specific country. While American markets have performed exceptionally well over the past century, numerous other markets worldwide have not shared the same fortune.
A better path forward
Rather than choosing between timing the market or blindly committing to time in the market, consider a more nuanced approach:
Incorporate some "certainty assets" that provide guaranteed returns or benefits
Plan for the worst-case scenario, not just average outcomes
Recognize that saving rates often matter more than return rates
Understand that your personal timeline matters more than historical averages
Having cash to roll with the punches can mean more to your returns than anything
The "time in the market" philosophy contains a kernel of truth—hasty reactions to market movements often lead to poor outcomes. However, treating long-term passive investing as inherently successful on auto-pilot is a dangerous path.
By questioning popular financial wisdom and adopting a more balanced approach, you can build a financial strategy that truly serves your unique circumstances, timeline, and goals - not just the industry's preferred narrative.
StackedLife Podcast
Episode 7: Term Life Insurance vs. Whole Life
When evaluating term life insurance vs. whole life, you've probably heard the advice to 'buy term and invest the difference.' This popular recommendation has one glaring problem: it uses simplistic grade school math to add up premiums and declares whole life insurance 'too expensive.'
But when we apply proper financial math—analyzing true lifetime costs, equity building, and the time value of money—the comparison looks dramatically different. In this episode, I show why whole life insurance is an asset that creates wealth rather than an expense, and why the 'cheaper' option might actually cost you hundreds of thousands more over your lifetime and millions generationally.
I’m John Perrings, Authorized Infinite Banking Practitioner and founder of StackedLife. Instead of taking high risk to get a high return, we help our clients implement strategies that create multiple safe returns with the same money. It’s geometric compounding that we call Stacked Interest Acceleration and IBC is the first step.
I’ve implemented IBC for hundreds of my clients and educated thousands more via my podcast, articles and courses at StackedLife.com.
Get my free mini-course, Adding Certainty to Supercharge Growth